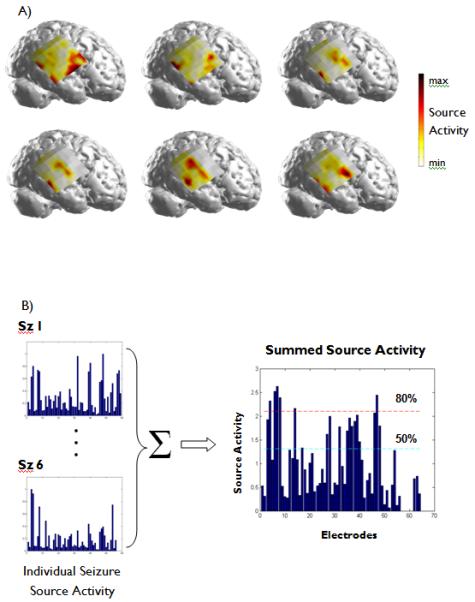
Figure 2.

(A)The significant source activity obtained from each of the six seizures analyzed in Patient 1. The red color indicates a high degree of source activity in each seizure. (B) The source activity from each electrode was normalized such that the maximum source activity for each seizure had unit strength. This source activity was summed over all of the analyzed seizures in each patient and thresholding was performed at 50% and 80% of the maximum summed activity. Here, the source activity obtained from the six seizures analyzed in Patient 1 are shown.
