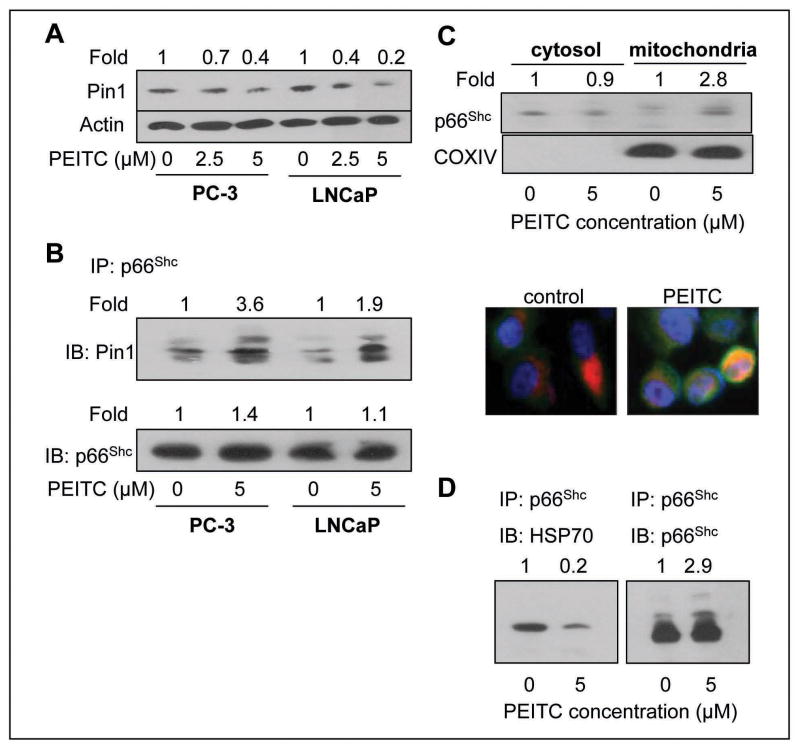
Fig. 4.
A, immunoblotting for Pin1 using lysates from PC-3 and LNCaP cells following 24 h treatment with DMSO or the indicated concentrations of PEITC. The blot was stripped and reprobed with anti-actin antibody to ensure equal protein loading. The numbers on top of the immunoreactive bands represent change in protein levels relative to corresponding DMSO-treated control. B, immunoblotting for Pin1 using p66Shc immunoprecipitates from PC-3 and LNCaP cells treated for 8 h with DMSO (control) or 5 μmol/L PEITC. The numbers on top of the immunoreactive bands represent change in levels relative to DMSO-treated control for each cell line. C, immunoblotting for p66Shc using isolated cytosolic and mitochondrial fractions from PC-3 cells following 8 h treatment with DMSO or 5 μmol/L PEITC. The blot was reprobed with anti-COXIV antibody to ensure purity of the mitochondrial fraction. The numbers on top of the immunoreactive bands represent change in levels relative to DMSO-treated control. Immunofluorescence microscopic analysis for p66Shc localization in PC-3 cells following 8 h treatment with DMSO or 2.5 μmol/L PEITC (magnification 100×). The staining for mitochondria (MitoTracker red), p66Shc, and nuclei are indicated by red, green and blue fluorescence, respectively. D, immunoblotting for HSP70 using p66Shc immunoprecipitates (using anti-p66Shc antibody) from control (DMSO, 8 h) or PEITC-treated (5 μmol/L, 8 h) PC-3 cells. The numbers on top of the immunoreactive bands represent change in levels relative to DMSO-treated control.

