
Figure 3.
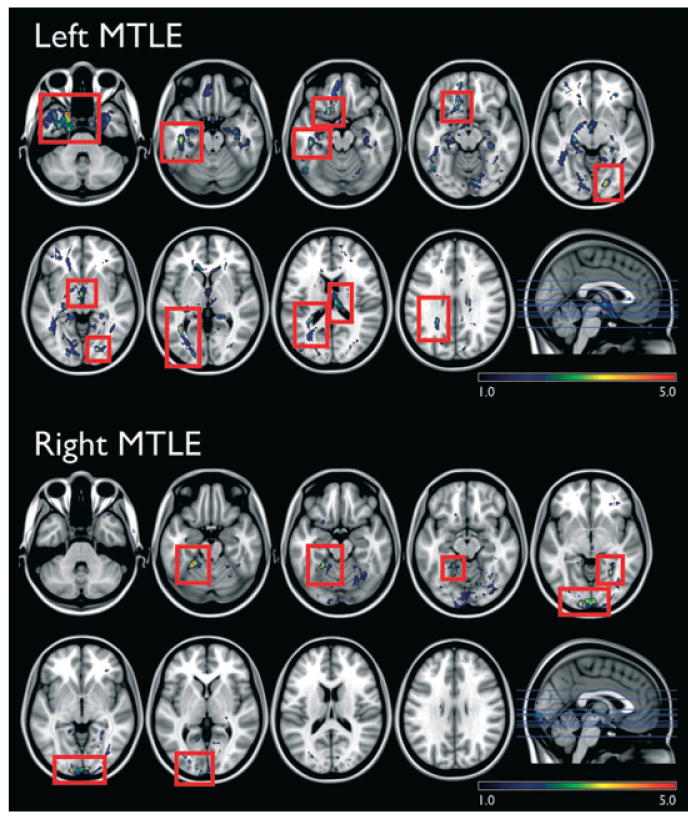
The location of significantly reduced hippocampal probabilistic tractography in patients compared with controls (red rectangles highlight the significant areas, above a critical threshold for repeated measures correction, Z = 3.1, left side and Z = 2.9, right side). The images are displayed in neurological convention, i.e., the left side represents the left side of the brain. The scale bars demonstrate the Z-scores.