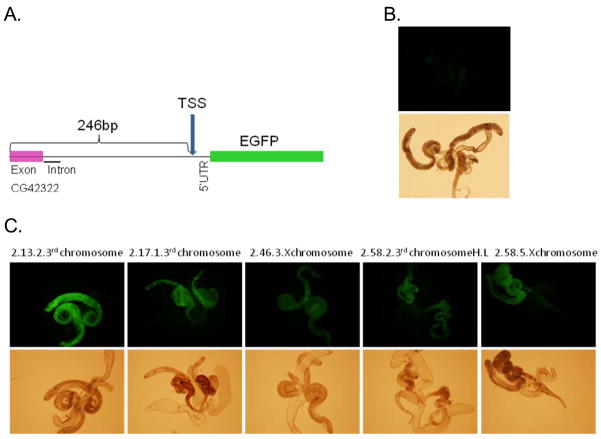
Figure 3.
Overview of the insert of the transformed construct is shown in Panel A. Panel B shows level of green fluorescence in testes in the control strain (w1118). Panel C shows EGFP florescence driven by the 272-bp region (246 bp upstream of the gene and 26 of 5′UTR) in the testis of five different transformants.

