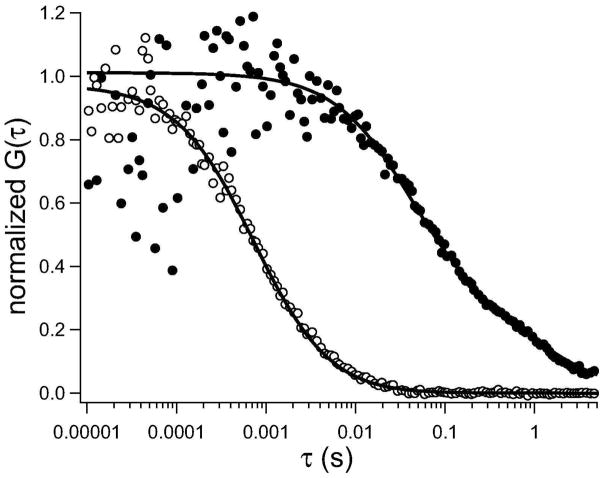
Figure 3.
Representative lateral diffusion of annexin in solution and membrane-bound state. Open circles represent the diffusion of Alexa488-anx a5 in solution, and the solid line represents the fit (Eq. 4). Closed circles represent the diffusion of Alexa488-anx a5 specifically bound to POPC bilayers containing 40 mol% POPS in the presence of Ca2+, and the solid line represents the fit to the data points best described by two-component Brownian motion (Eq. 5, m = 2).

