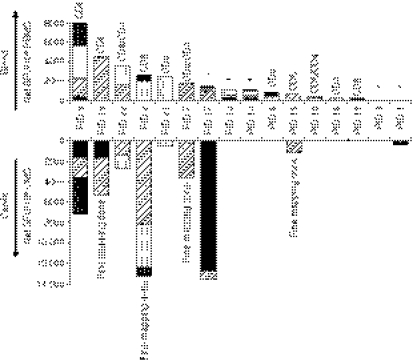
Figure 2.
Comparison of cervical and blood human immunodeficiency virus (HIV) Gag-specific interferon-γ (IFN-γ) responses in women with chronic HIV infection. Blood (top panel) and cervical (bottom panel) IFN-γ responses to HIV-1 subtype C Gag peptide pools 1–5. Net spot forming units (SFU)/106 was calculated by subtracting background IFN-γ frequency from Gag peptide pool-specific IFN-γ frequencies in 16 women with chronic HIV infection. Each stacked bar represents the cumulative IFN-γ frequency for all five Gag peptide pools and the subjects have been ordered from highest to lowest blood T-cell magnitude to Gag. The contribution of CD4+ and CD8+ T-cell subsets to overall IFN-γ responses to HIV Gag peptides was determined by intracellular cytokine staining and fluorescence-activated cell sorting. The T-cell subset contributing to Gag-specific responses per donor is shown above each stacked bar for blood responses. CD8 indicates CD8-only response, CD4 indicates CD4 responses only and CD8/CD4 indicates that responses in both subsets were detected. Asterisks indicate that responses were not evaluated in these individuals. ‘Fine mapping done’ denotes the four women for whom this analysis was carried out.

