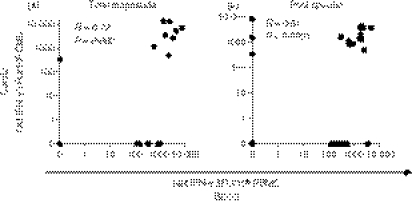
Figure 3.
Correlation between human immunodeficiency virus (HIV) Gag-specific interferon-γ (IFN-γ) response magnitudes detected at the cervix and in blood of HIV-infected subjects. (a) Correlation between cumulative net IFN-γ responses to Gag pools (sum of five pools) per chronically HIV-infected individual in each compartment (n = 16 women for whom matched enzyme-linked immunosorbent spot-forming cell assay was conducted on cervical lines and peripheral blood mononuclear cells). (b) Correlation between individual Gag pools (1–5) at the cervix and in blood in HIV-infected women. Each data point represents an individual’s IFN-γ response at the cervix and in blood. Spearman Rank Test was applied to test correlations and P-values < 0·05 were considered significant. Spearman R-value is shown on each plot.

