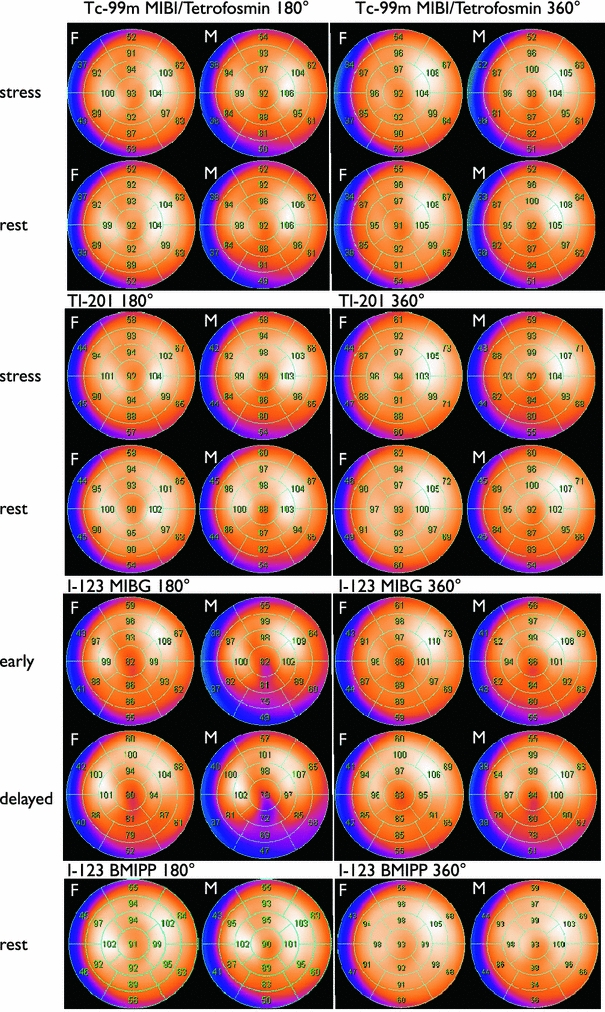
Fig. 1.

Polar map presentation of normal myocardial SPECT databases using a 17-segment model. Average segmental values are overlaid on the maps. Upper two panels stress and rest perfusion studies with 99mTc-labeled tracers (MIBI and tetrofosmin) and 201Tl using 180° and 360° acquisition methods. Lower two panels123I BMIPP and 123I MIBG studies with 180° and 360° acquisition methods
