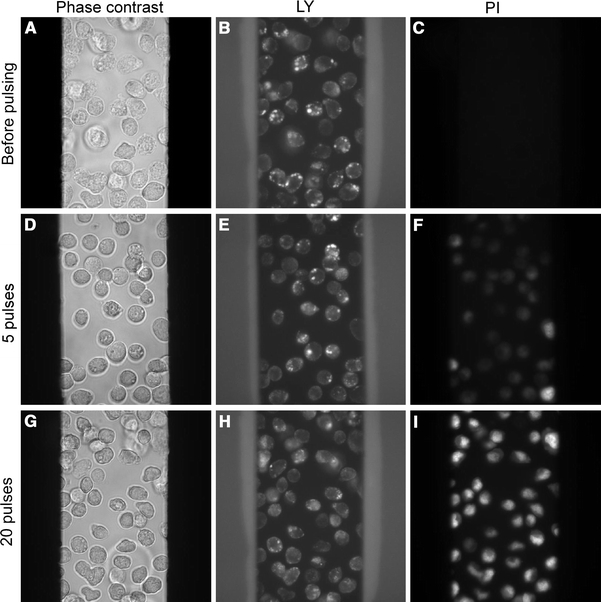
Fig. 2.

LY release and PI uptake after applying nsEP. Phase contrast, LY and PI images of cells before pulsing, and 10 min after applying 5 and 20 pulses (60 ns, 50 kV/cm, and 1 kHz)

LY release and PI uptake after applying nsEP. Phase contrast, LY and PI images of cells before pulsing, and 10 min after applying 5 and 20 pulses (60 ns, 50 kV/cm, and 1 kHz)