
Fig. 3.
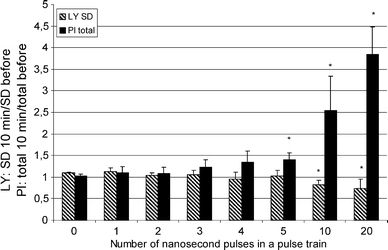
LY release and PI uptake after applying trains of nsEP with various numbers of pulses. For LY: SD of fluorescence intensities of pixels corresponding to cells 10 min after pulsing divided by SD of fluorescence intensities of pixels corresponding to cells before pulsing. For PI: total PI intensity of cells 10 min after pulsing, divided by total PI intensity before pulsing. SD of LY decreases significantly after applying 10 and 20 pulses, implying that LY is released from endocytotic vesicles. PI enters the cells already after the application of 5 pulses, implying that the plasma membrane is permeabilized. The pulses: 60 ns, 50 kV/cm, 1 kHz repetition frequency. Each value represent mean of 5 independent experiments ± SD. * Indicate significant differences from control—zero pulses (P < 0.05)