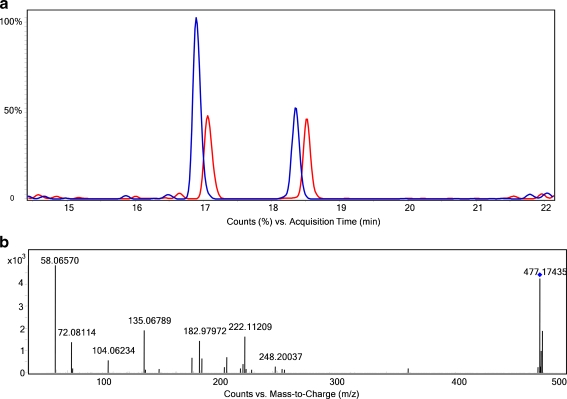
Fig. 6.
Analysis of aldehyde biomarkers in plasma. a Comparison of extracted-ion chromatogram of m/z 477 for control (red) and AAPH-treated (blue) plasma, b MS/MS spectrum of the elevated peak at 17 min. The following gradient was used: 100% mobile phase A (95% H2O + 5% MeOH + 0.1% formic acid) was maintained for 5 min and then solvent B (5% H2O + 95% MeOH + 0.1% formic acid) was increased from 5% to 90% in 25 min (long gradient) with a 5-min hold at 90% B. After this, the column was reconditioned for 10 min at 100% mobile phase A

