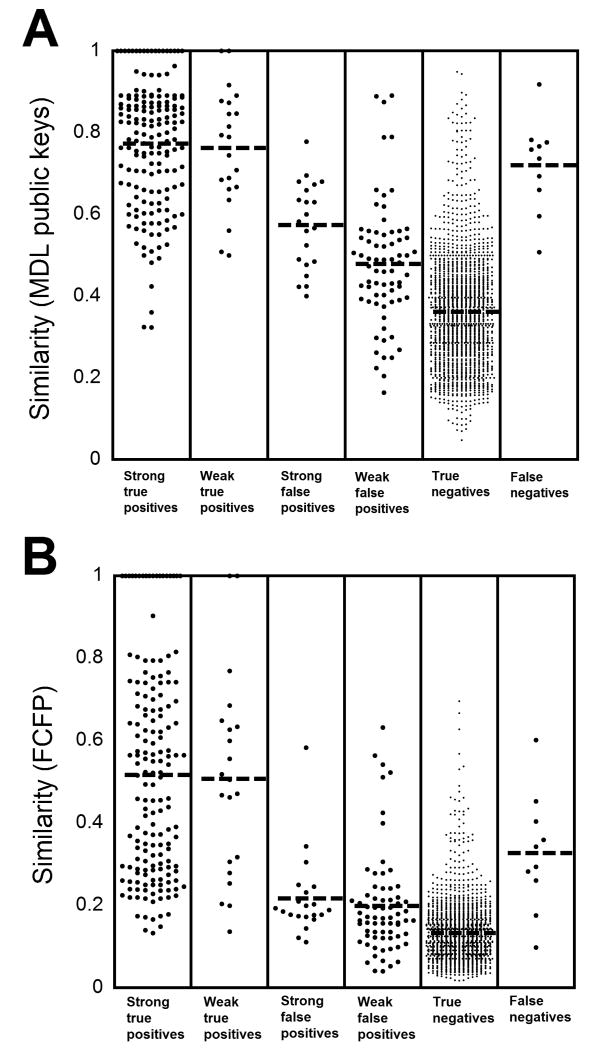
Fig. 2. Plot of similarity of all data for DOA/Tox screening assays.
As described in “Materials and Methods”, cross-reactivity data for each DOA/Tox assay were used to classify compounds in one of six categories: “Strong True Positives”, “Weak True Positives”, “Strong True Positives”, “Weak True Positives”, “True Negatives”, and “False Negatives”. (A) Plot of data for all compounds using MDL public keys similarity and the Tanimoto coefficient. See text of “Results” for standard deviation values. (B) Plot of data for all compounds using FCFP_6 and the Tanimoto coefficient. See text of “Results” for standard deviation values.

