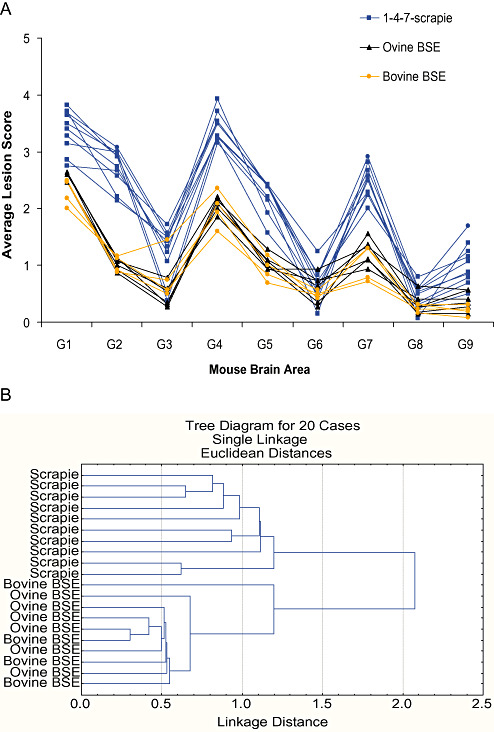
Figure 3.

The 1‐4‐7‐scrapie profile is not consistent with BSE. A. Average lesion profiles for 1‐4‐7‐scrapie isolates plotted against 10 BSE isolates (four bovine, six ovine passaged) for comparison. B. Tree diagram after cluster analysis (Statistica 7.0 statistical software, StatSoft Inc.) of the vacuolation scores in selected neuroanatomic brain areas to show that scrapie and BSE form two distinct groups as measured by Euclidean distance. Abbreviation: BSE = bovine spongiform encephalopathy.
