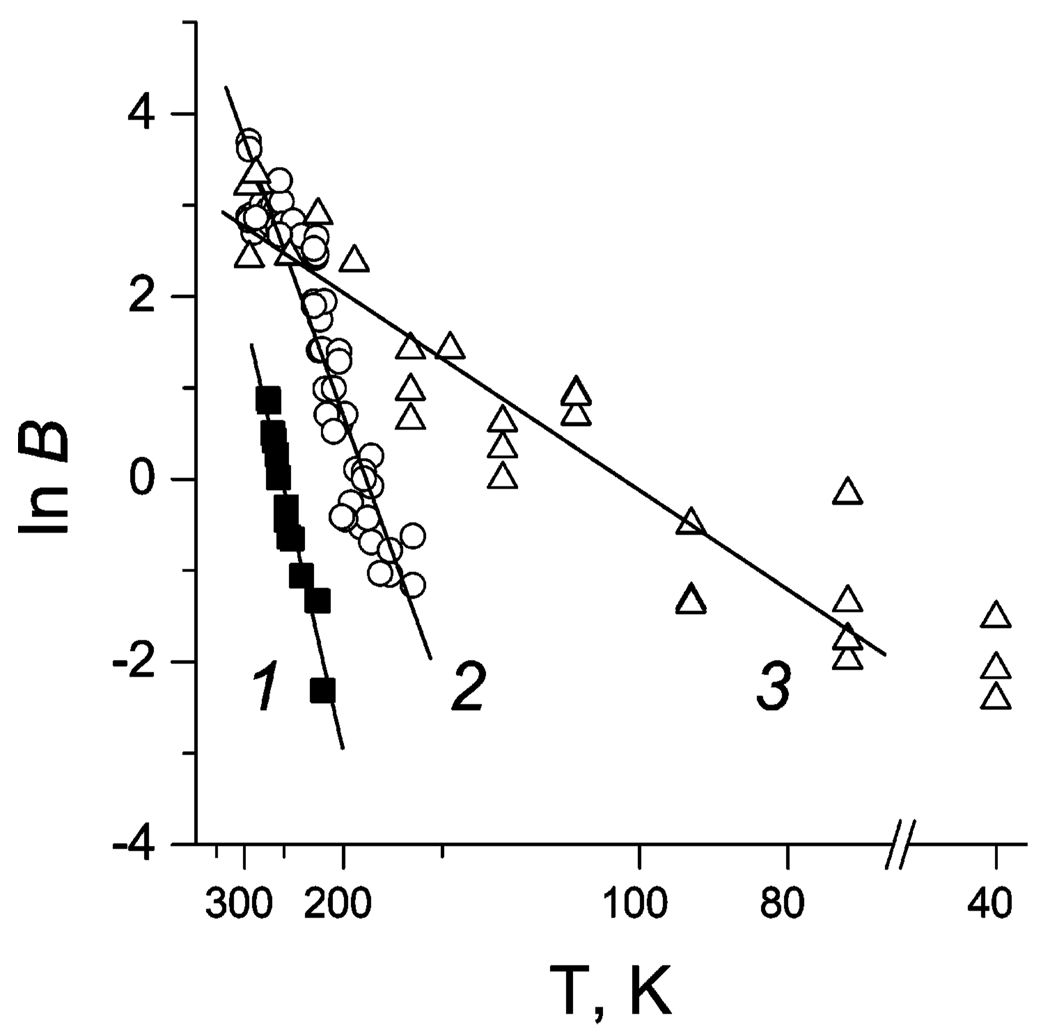
Figure 3.
Plot of experimental values of ln B, eq 13, as a function of inverse temperature for three states of reduction. Filled squares, state 1; open circles, state 2; open triangles, state 3. Lines, least-squares fits to determine ΔS and ΔE. Three points at T = 40 K were not accounted for in the state 3 fitting.

