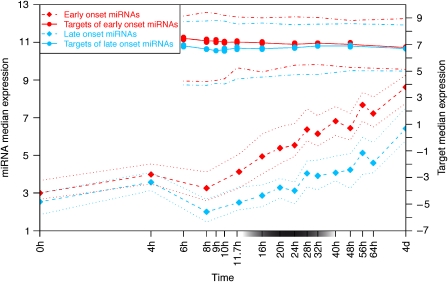
Fig. 5.
Variation of miRNA and target genes expression during development. Median expression of “early onset” miRNAs (red dashed line, diamonds; n=65) and their targets (red line, circles; n=119), and of “late onset” miRNAs (blue dashed line, diamonds; n=44) and their targets (blue line, circles; n=253). Dotted lines represent quartiles of miRNA expression; dot-dashed lines represent quartiles of target gene expression. Differences between the two target groups and significance are show in Fig. S3. The gray box on the x-axis indicates the presumed phylotypic period. The x-axis is in logarithmic scale.

