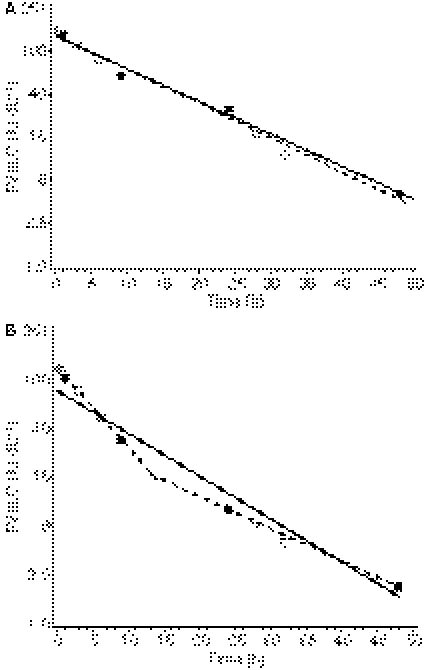
Fig. 1.
Representative FVIII:C vs. time curves from two adult patients as evaluated by one- or two-phase linear regression. When the full sampling schedule is used, the fitted curve is monophasic for patient A and biphasic for patient B. With data from the reduced sampling schedule, only monophasic curves can be fitted for both patients. Key to symbols: open and filled circles and dashed line = biphasic fit, filled circles and solid lines = monophasic fit.

