
Figure 4.
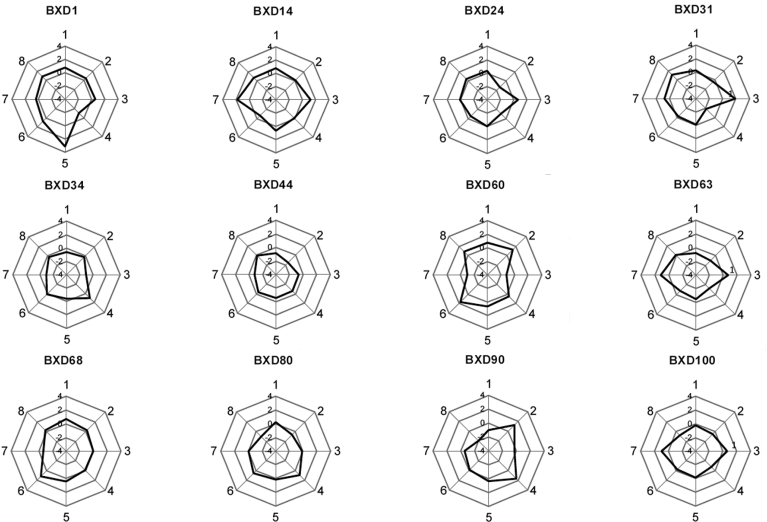
Factor scores from individual strains plotted on a set of axes each representing a factor show a behavioral profile of each strain. Although some strains exhibit different magnitudes of similar profiles, others are distinct. Axes labels represent the first eight factors: (1) injection stress-induced locomotor activity, (2) morphine withdrawal (3) morphine response, (4) reactivity, (5) locomotor activity in a novel environment, (6) conflict avoidance, (7) morphine activity duration and (8) cocaine sensitization. All strain profiles are available in supplementary figure.