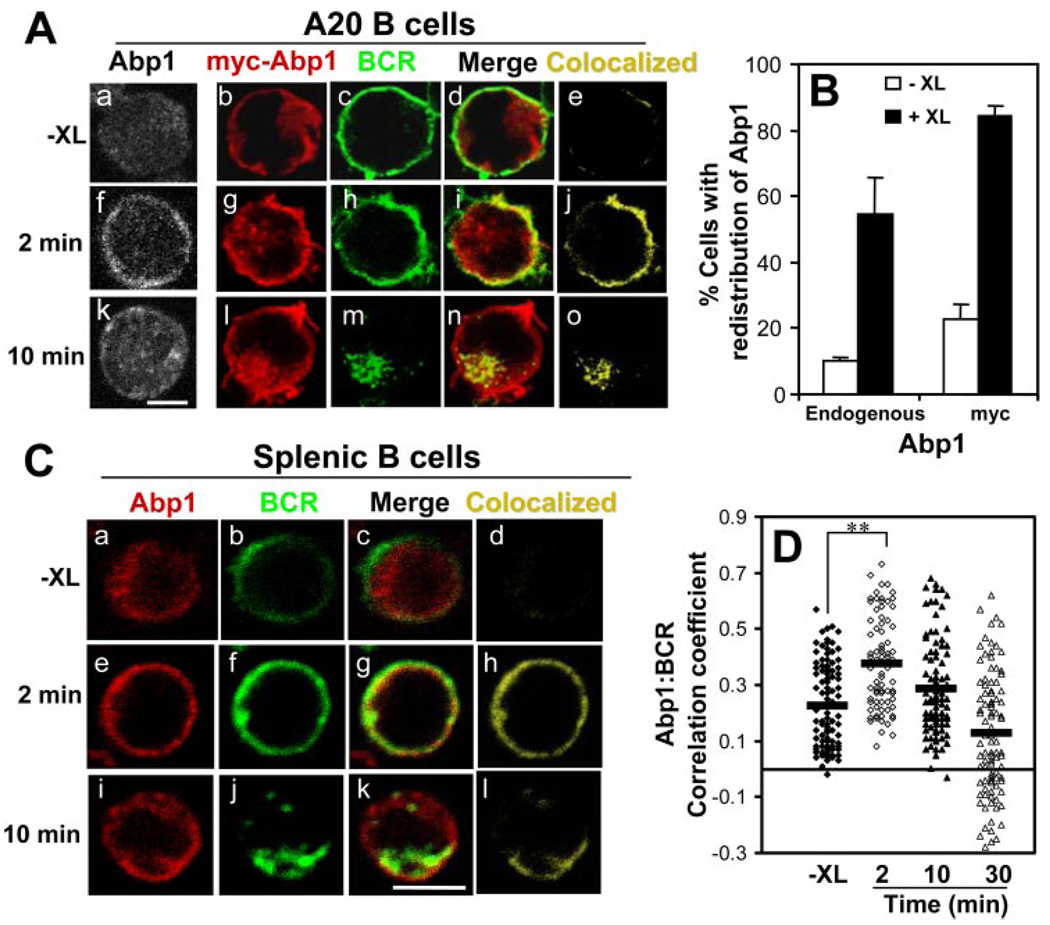
FIGURE 4.
BCR activation induces the redistribution of Abp1 to the plasma membrane. A and C, A20 (A) and splenic B cells (C) were treated (+XL) or untreated (−XL) with either goat anti-mouse IgG (A, a, f, and k) or AF488 goat anti-mouse IgG + M (A, b–e, g–j, and l–o, and C) at 4°C and chased at 37°C for indicated times. After fixation and permeabilization, cells were labeled with anti-Abp1 Ab for the endogenously expressed Abp1 (A, a, f, and k, and C) or anti-myc Ab for myc-Abp1 (A, b–e, g–j, and l–o). Cells were analyzed using a confocal fluorescence microscope. Shown are representative images from three independent experiments. Bar, 5 µm. B, The redistribution of endogenous Abp1 and myc-Abp1 from the cytoplasm to the cell surface after BCR cross-linking for 2 min was quantified by visual inspection. Over 100 cells from five randomly selected fields of each experiment were analyzed, and the numbers of cells showing Abp1 concentrated on the cell surface were plotted as percentages of the total number of cells inspected. Shown are averages (±SD) from three independent experiments. D, The correlation coefficients of endogenous Abp1 with the BCR in splenic B cells before and after BCR cross-linking was determined using the LSM510 software. Shown are the data generated from >100 cells of two independent experiments.  , Indicate the mean. **, p < 0.0001.

