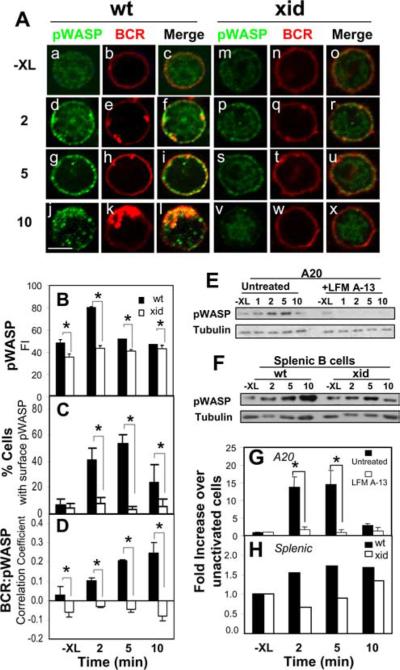
FIGURE 3.
BCR activation increases the phosphorylation of WASP and colocalization of pWASP with the BCR in a Btk-dependent manner. A, Splenic B cells from wt and xid mice were stained with Cy3-Fab-anti-μ for the BCR and stimulated with F(ab′)2-anti-Ig at 37°C for indicated times. The cells were fixed, permeabilized, and stained with an Ab specific for WASP phosphorylated at S483/S484 (pWASP). The cells were analyzed using a confocal fluorescence microscope. Shown are representative images of three independent experiments. Bar, 3 μm. B, Shown are the means (±SD) of pWASP fluorescence intensity of >300 cells from three independent experiments (*, p ≤ 0.005). C and D, Cells showing membrane redistribution of pWASP were visually determined and quantified. The data were plotted as percentages of total cells in images (C). The correlation coefficients between the BCR and pWASP in wt and xid B cells were determined using the LSM 510 software (D). Shown are the average results of three independent experiments where >300 cells were analyzed (*, p ≤ 0.005). E–H, A20 B cells that were treated with or without LFM A-13 (E and G) and splenic B cells from wt and xid mice (F and H) were stimulated with F(ab′)2-anti-Ig for indicated times. The cells were lysed, and the cell lysates were analyzed using SDS-PAGE and Western blot, and probed for pWASP S483/S484. The blots were stripped and reprobed for tubulin as loading controls. The blots were analyzed by densitometry. pWASP levels were normalized against tubulin levels, and the data were plotted as fold increases over unstimulated levels (G and H). Shown are representative blots and plots of three independent experiments (*, p ≤ 0.05).

