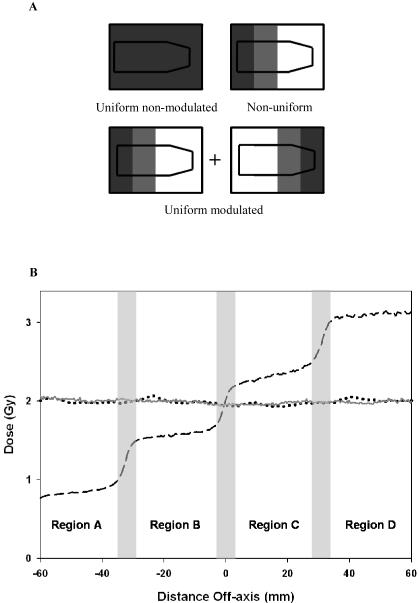
Figure 2.
Measured profiles in the direction of MLC’s (GT). Figure 2a shows a schematic representation of dose profile for each of the different field configurations. Figure 2 b shows actual profile using Gafchromic film delivering 2 Gy to the centre of the culture flask. Three different field configurations were delivered; uniform non-modulated (solid line), uniform modulated (dotted line) and non-uniform modulated (dashed line). The non-uniform modulated configuration was separated into four dose regions by excluding the penumbra and defined as regions A – D.

