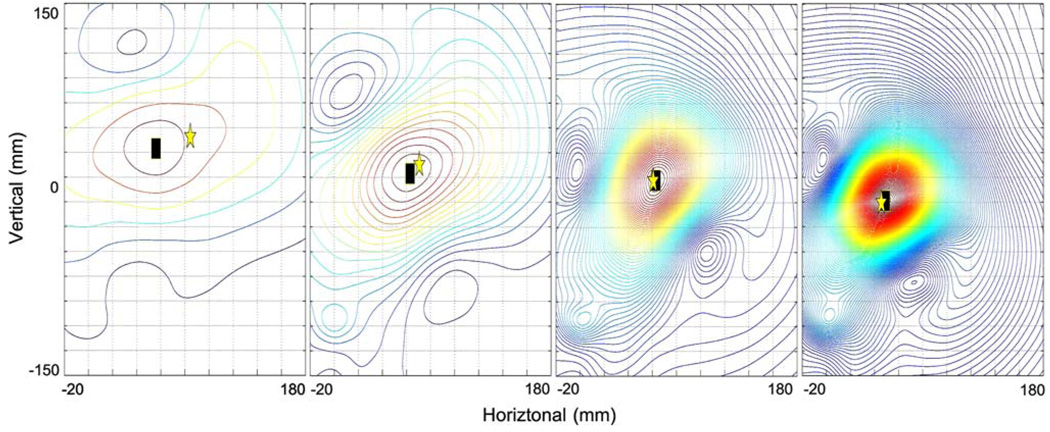
FIGURE 4.
Contour plot of the surface current density (SCD) maps corresponding to the magnetic field maps presented in Fig. 3. The maximum point of the SCD map (black square) shows the estimated location of the underlying dipole source. The location of the actual dipole source is indicated by the gold star.

