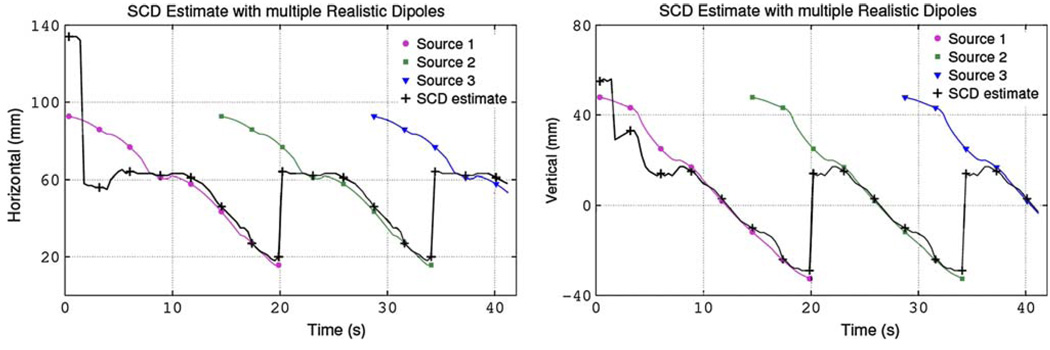
FIGURE 8.
Estimates of the dipole source position (black) when a sequence of overlapping dipole sources (purple circle, green square, blue triangle) was present. Shown are (a) the horizontal position and (b) the corresponding vertical position against time (markers indicate solutions at approximately 3-s intervals). The result for the first 15 s (when only one source is present) is identical to the single realistic dipole simulation. In the presence of multiple sources, the proximal source (located close to the sensors) dominated and this point corresponded to the maximum point in the SCD map. Once the proximal source terminated at the pylorus, the parameters corresponding to the distal source were estimated.

