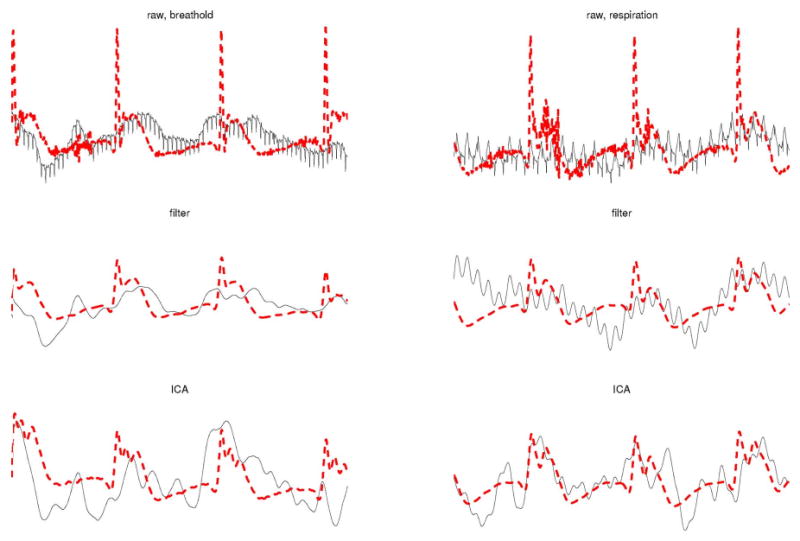
Fig. 1.

Validation across techniques of CF and ICA for artifact removal. MGG signals are shown as continuous (black color online) traces while EMG signals are shown as dashed (red color online) traces. The left column displays data acquired during a breathhold while the right column displays data acquired during respiration. The time interval shown is of 1 min in both cases. The first row displays raw data, the second row displays filtered data, and the third row displays ICA-processed data.
