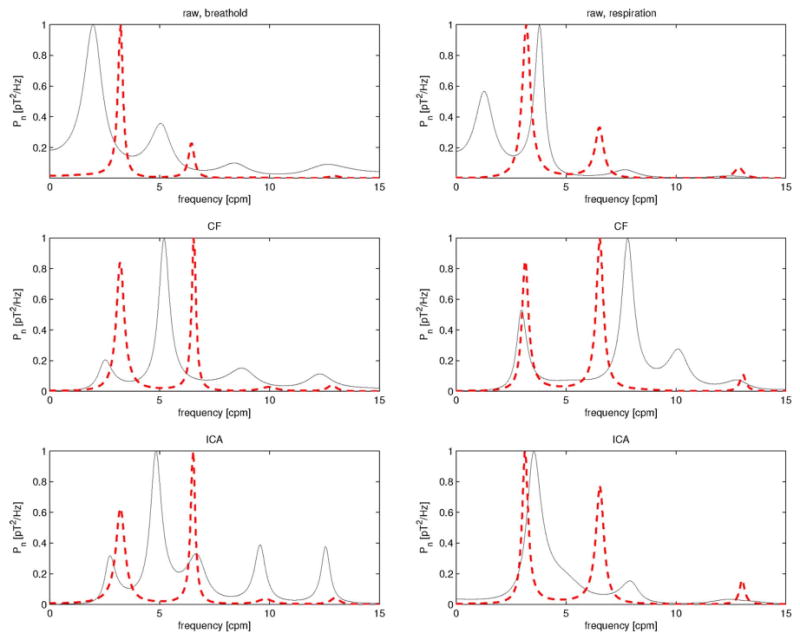
Fig. 3.

Frequency analysis results for the EMG/MGG data segments displayed in Figs. 1 and 2. MGG spectra are shown as continuous (black color online) traces while EMG spectra are shown as dashed (red color online) traces. The left column displays data acquired during a breathhold while the right column displays data acquired during respiration. The first row displays spectra for raw data, the second row displays spectra for filtered data, and the third row displays spectra for ICA-processed data. The units on the horizontal axis are hertz, while the vertical axis represents power displayed in units of picotesla squared per hertz. This figure demonstrates that, with regard to the frequency domain, CF and ICA perform comparably in identifying the dominant frequencies in the case of EMG. For MGG, however, ICA is clearly preferable for segments of data acquired during respiration, which is illustrated by the good agreement of the ICA MGG spectrum (third row, right) with the raw MGG spectrum (first row, right), whereas in the case of CF processing of MGG data (second row, right), there are false peaks that do not appear in the raw data spectrum.
