
Fig. 4.
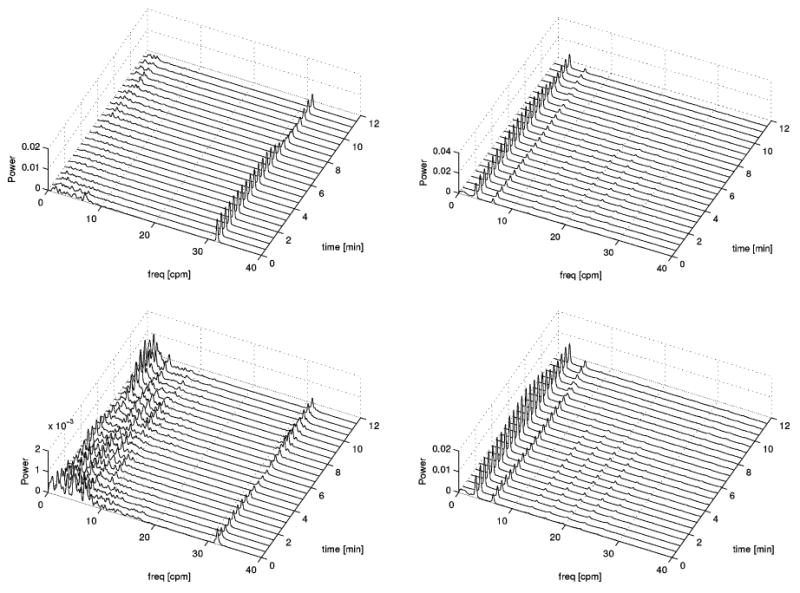
Comparison of waterfall plots for simultaneous EMG and MGG. The first columns displays MGG results and the second column displays EMG results. The first row refers to filtered data and the second row refers to ICA-processed data. The frequency range displayed is 0–40 cpm.