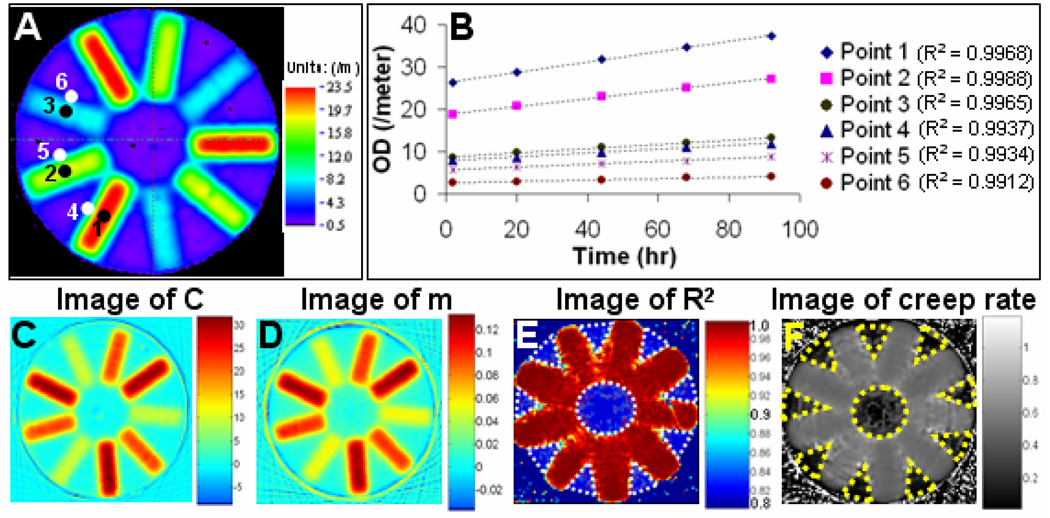
Fig. 4. Temporal stability of radiochromic response.
A) Central slice radiochromic response. B) Temporal variation for six representative points which are shown in A, C, D, E & F) The linear regression model for each point in central slice. C&D are images of parameters C and m. E is an image of the R2 value of linear fit. F is an image of the creep rate calculated from the parameters of the fit.

