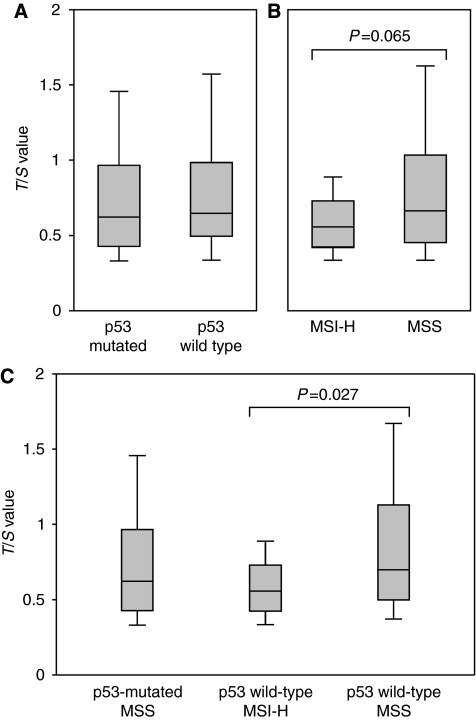
Figure 3.
Relative telomere lengths, expressed as T/S values, in tumours according to (A) mutated (n=49) or wild-type (n=69) p53 gene, and (B) high microsatellite instability (MSI-H) (n=28) or stable microsatellite (MSS) (90) status. (C) Relative telomere lengths, expressed as T/S values, in p53 mutated MSS (n=45), p53 wild-type MSI-H (n=24), and p53 wild-type MSS (n=45) tumours. Boxes and whiskers represent the 25th–75th and 10th–90th percentiles, respectively; the median is the central line in each box.

