Figure 3.
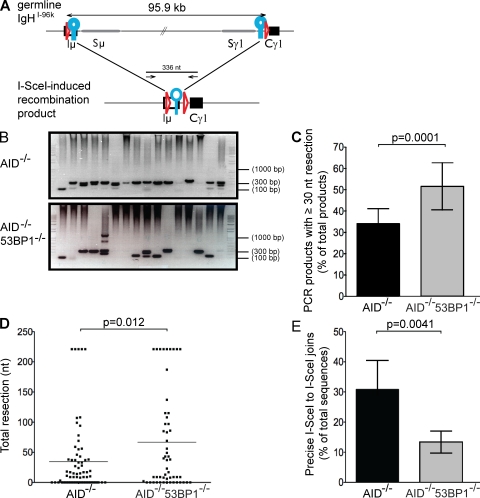
Loss of 53BP1 leads to increased end resection. (A) Schematic representation of IgHI-96k allele (top) with the PCR primers used to amplify a 336-nt recombination product, indicated as arrows (bottom). LoxP sites are indicated as red triangles, and I-SceI sites are indicated as blue circles. (B) Representative ethidium bromide–stained argarose gels showing PCR products obtained after I-SceI–induced recombination in IgHI-96kAID−/− and IgHI-96kAID−/−53BP1−/− B cells. (C) Bar graphs showing frequency of I-SceI–induced recombination products running ≤300 nt for IgHI-96kAID−/− and IgHI-96kAID−/−53BP1−/− B cells, determined by 12 independent PCR experiments. Error bars indicate standard deviation. The p-value was calculated using a two-tailed Student’s t test. (D) Dot plot showing total resection of I-SceI–infected IgHI-96kAID−/− and IgHI-96kAID−/−53BP1−/− B cells. Each dot represents one sequence. The p-value was calculated using a two-tailed Student’s t test. The means are shown as horizontal lines. (E) Bar graph shows the frequency of perfect I-SceI joins in I-SceI–infected IgHI-96kAID−/− and IgHI-96kAID−/−53BP1−/− B cells in five independent experiments. Error bars indicate standard deviation. The p-value was calculated using a two-tailed Student’s t test.

