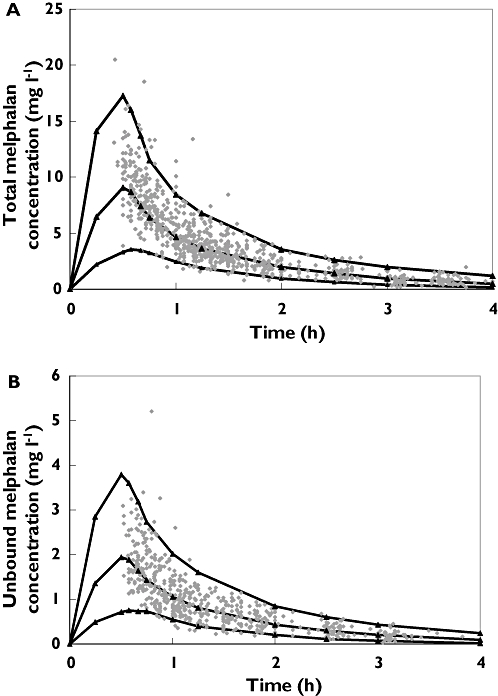
Figure 4.

Visual predictive check of A) total and B) unbound melphalan concentration vs. time curves, comparing observed data (solid data points) with the 5th, 50th and 95th percentiles of simulated data (n= 500) generated using the final Covariate Population Pharmacokinetic models (solid lines)
