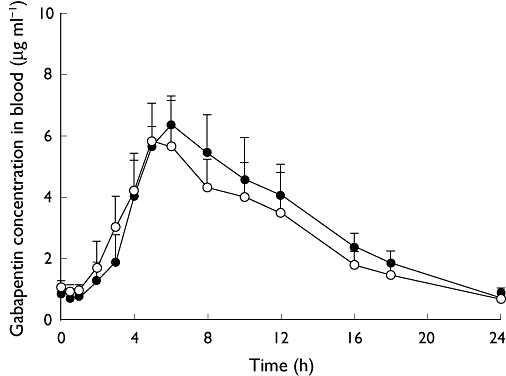
Figure 2.

Mean (SD) concentrations of gabapentin in blood at steady state after dosing of gabapentin enacarbil alone and concomitantly with naproxen. n= 10 subjects per treatment. One subject (subject 007) was excluded from mean and SD calculations due to early termination during period 3. SD, standard deviation. Gabapentin enacarbil (–○–); Gabapentin enacarbil + naproxen (–•–)
