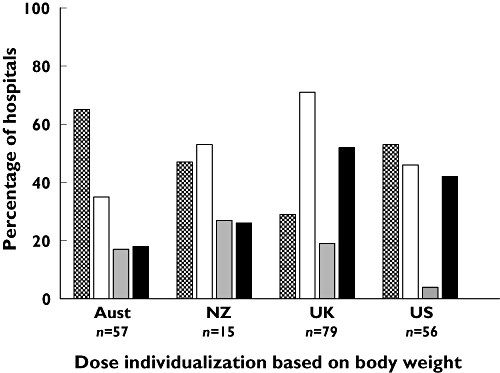
Figure 3.

Percentage of hospitals per country that dose-individualize based on body weight. n, the number of hospitals that use protocols per country. Aust, Australia; NZ, New Zealand; UK, United Kingdom and US, United States. Hospitals that cap the dose ( ); Hospitals that do not cap the dose (
 ); Hospitals that do not cap the dose but use a lean body weight descriptor for dose calculation (
 ); Hospitals that use the PL (
 )
)
