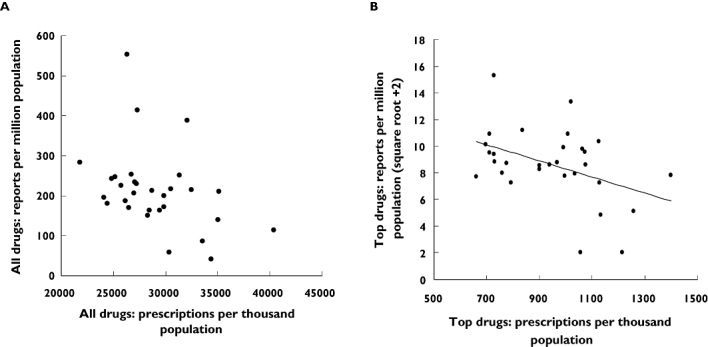
Figure 1.

ADR reports per million population vs. number of prescriptions per thousand population in the West Midlands during the financial years 2004–05 and 2005–06. A) ADR reports per million population for all drugs and prescriptions per thousand population for all drugs (rs=−0.413, P < 0.05). B) ADR reports per million population (square root + 2 transform) for ‘top drugs’ and prescription per thousand population for ‘top drugs’ with fitted line (r= -0.420, P (two-tailed) < 0.05, r2= 0.18)
