
Figure 2. The anti-NDV response is highly correlated across samples and donors.
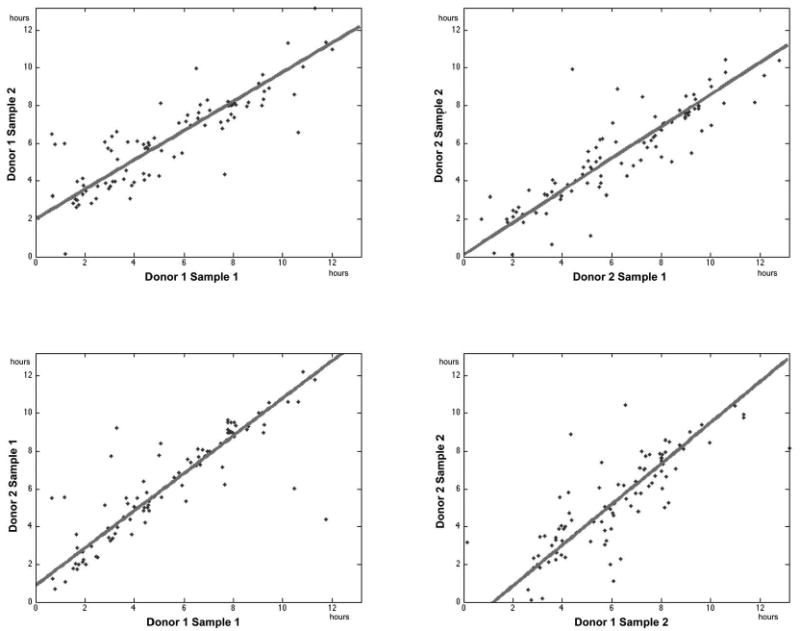
The initial up-regulation times were estimated for a set of genes known to be involved in pathogen responses using a model-based analysis. Up-regulation times for individual genes (points) were compared across samples from the same donor (upper row) and between donors for the same sample (bottom row). The extent of conservation was determined using orthogonal least-squares linear regression (solid lines). The correlation for each comparison was, starting at the top left corner and moving clockwise: 0.85, 0.88, 0.81 and 0.87.