
Figure 3. Dynamic activity profiles and target overlap for transcription factors in the NDV response network.
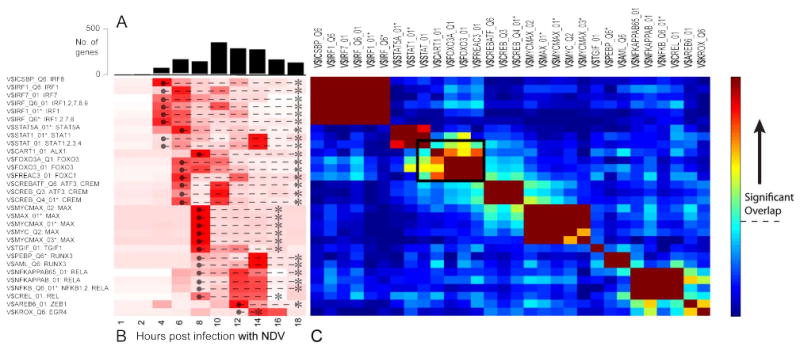
(A) The number of genes first up-regulated at each time point, split by TF (white bar) and non-TF (black bar) genes. (B) Heatmap showing the over-representation of targets associated with each of the TRANSFAC matrices in the network (rows) over time (columns). The colors are row normalized -log(P values). Darker red indicates greater inferred activity of the transcription factor(s). The temporal activity window of each TF matrix (● --- *) was inferred from the union of the activity of all the individual TFs represented by that matrix. (C) Heatmap quantifying the extent of overlap between predicted targets of each TRANSFAC matrix (rows and columns). Colors indicate -log(P values) of the hypergeometric test. The threshold for statistical significance assuming a Bonferroni-corrected P value of 0.05 is indicated by the dashed line on the color bar. Matrices that could be individually removed without any loss of coverage are marked with an asterisk (*). The black box indicates a region of high overlap between TFs from different families, suggesting possible cooperativity.