
Figure 6. Gene ontology analysis of TF targets.
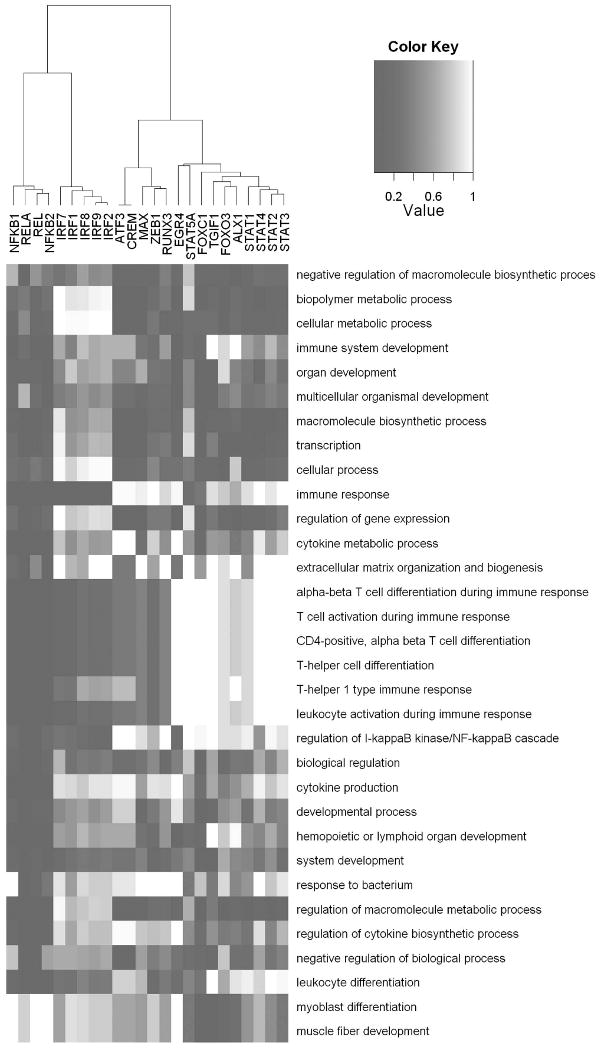
Each row corresponds to a GO term that was significantly enriched (p<0.001) for the targets of at least one transcription factor. The colors indicate absolute P values (darker for increased significance) computed using the conditional test in the GOstats package in Bioconductor. Hierarchical clustering of the columns was carried out using the Euclidean distance metric and Ward's linkage.