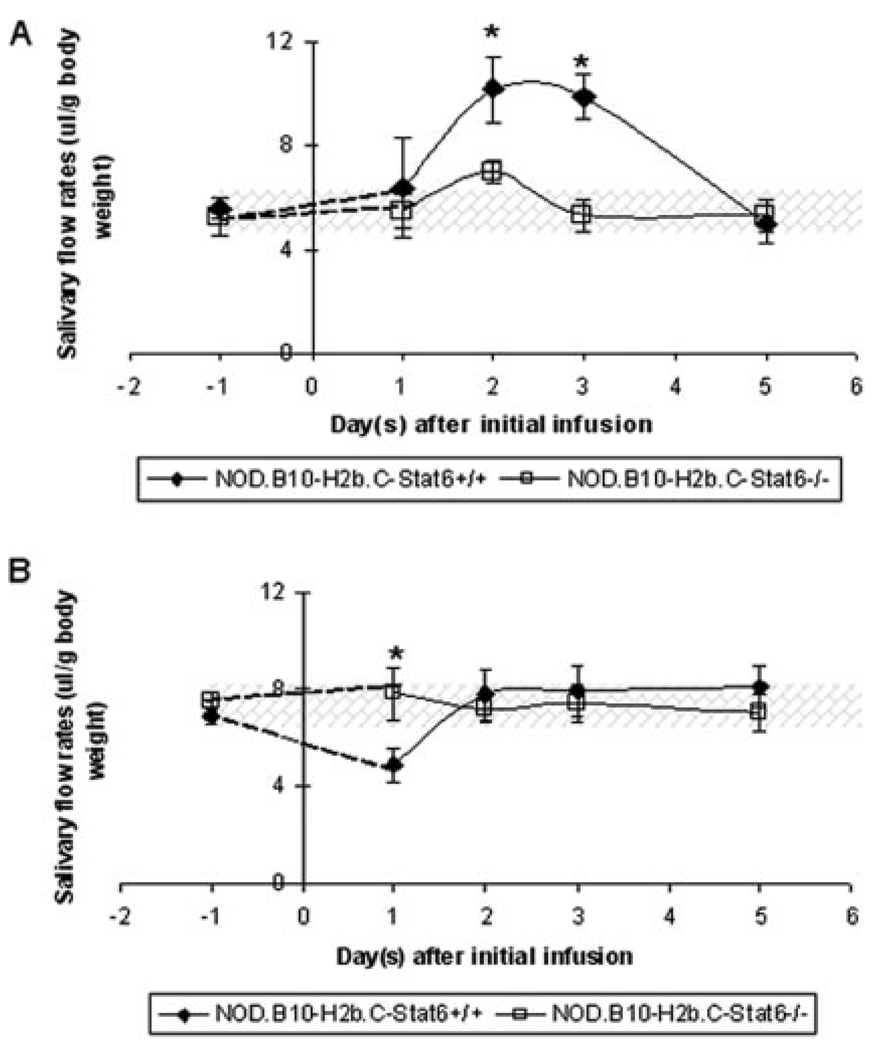
FIGURE 7.
Salivary flow rates of C57BL/6 mice after injections of IgG isolated from NOD.B10-H2b.C-Stat6+/+ or NOD.B10-H2b.C-Stat6−/− mice. Temporal changes in salivary flow rates of male C57BL/6 mice injected with whole IgG collected from individual 6-wk-old NOD.B10-H2b.C-Stat6+/+(n = 4F) or NOD.B10-H2b.C-Stat6−/− (n = 5M and 3F) mice (A) and 16-wk-old NOD.B10-H2b.C-Stat6+/+(n = 5F) and NOD.B10-H2b.C-Stat6−/− (n = 2M and 3F) mice (B). Mice were injected i.p. with 500 µg of fractionated IgG. All values are expressed as mean salivary flow rates ± SEM. Statistical analysis was performed by two-tailed, paired Student t test using GraphPad InStat software (*, p < 0.05).

