Figure 1.
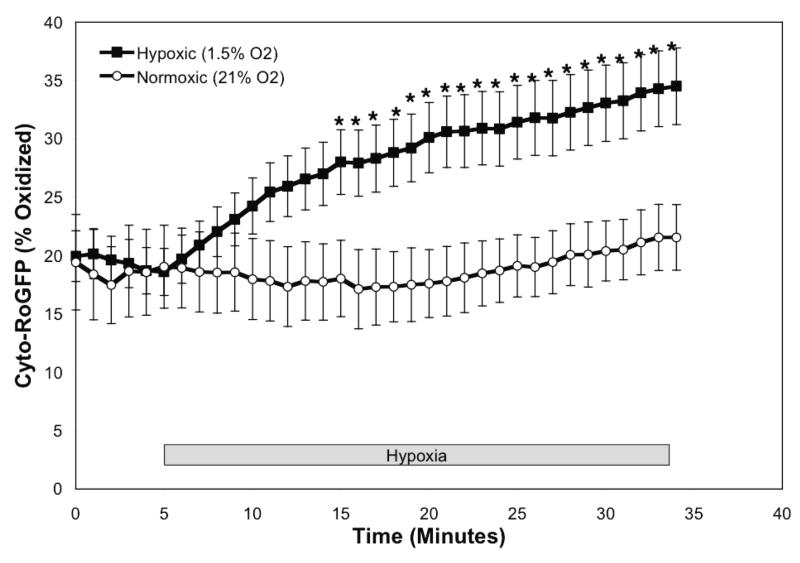
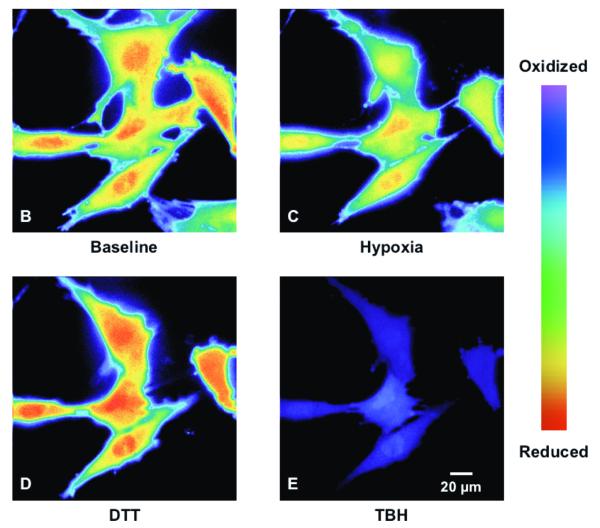
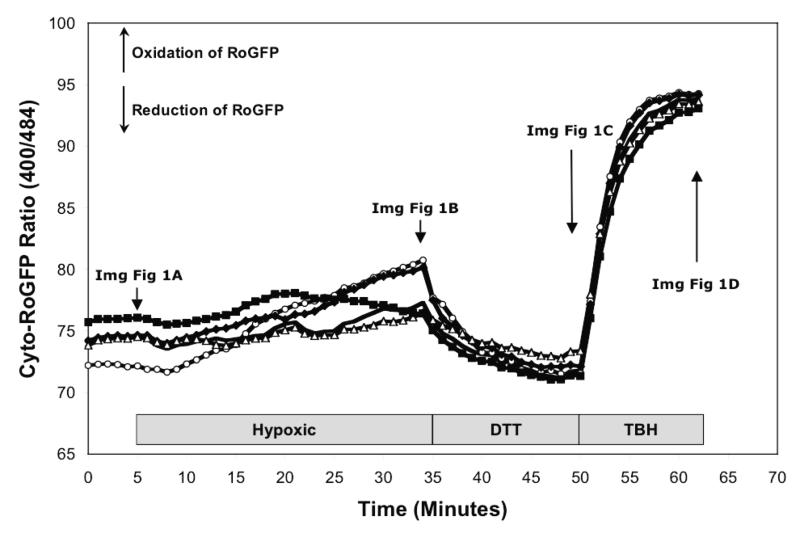
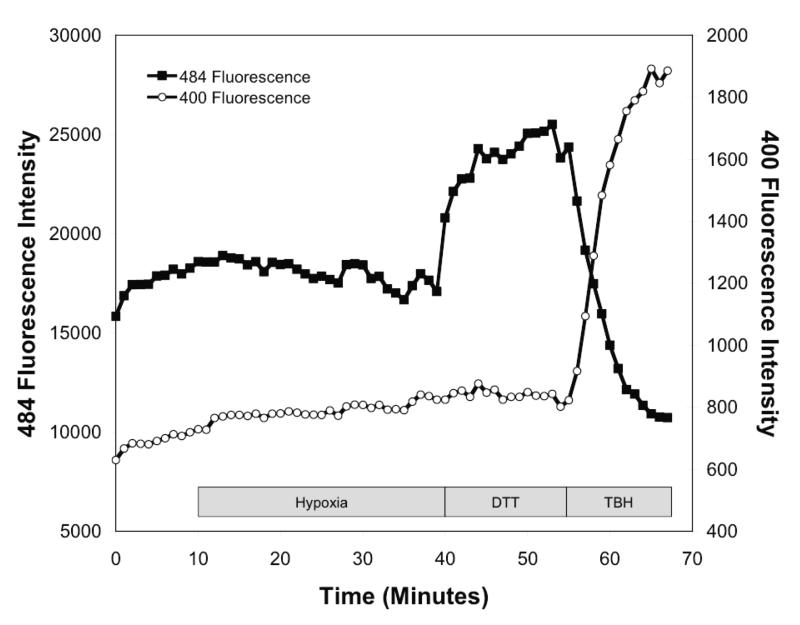
Hypoxia shifts the cytosol to a more oxidized state in PASMC. (A) Combined results from multiple experiments in PASMC expressing Cyto-RoGFP and superfused with either normoxic (21% O2) or hypoxic (1.5% O2) media. (B-E) False-color ratiometric images of PASMC demonstrate the dynamic redox range of the Cyto-RoGFP sensor. PASMC expressing Cyto-RoGFP were superfused with normoxic (21% O2) media (B), then with hypoxic (1.5% O2) media for 30 min (C), followed by media containing DTT to fully reduce the sensor (D), and then with media containing tBH to fully oxidize the sensor (E). (F) Representative time course, quantitative analysis of the fluorescence intensity ratio from representative individual PASMC imaged in B-E. ‘Img Fig’ denotes the time at which the images B-E were captured during the experiment. (G) Representative time course, quantitative analysis of the reciprocal changes in Cyto-RoGFP fluorescence intensity at the two excitation maxima (484 and 400 nm) for a single PASMC. Values are means ± S.E., n=6 cover slips, 4-10 cells/cover slip. *p<0.05 compared to normoxia.


