
Figure 1.
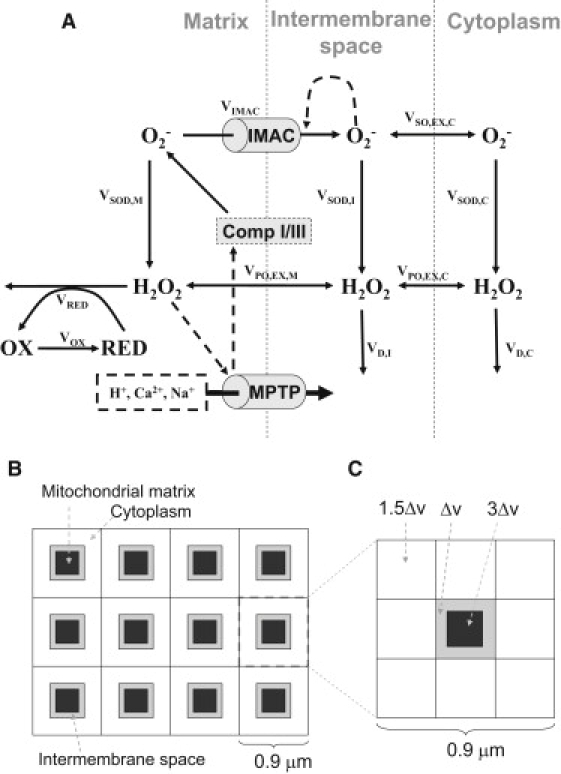
Schematic diagrams of ROS-induced ROS release models. (A) The single mitochondrion model including both IMAC- and MPTP-mediated pathways. (B) Schematic diagram of the spatial model of mitochondrial network. (C) For computational purposes, each unit is composed of 3 × 3 voxels representing a mitochondrion with its surrounding cytoplasm: the center voxel represents both the matrix (black) and the intermembrane space (gray), and the surrounding eight lattices are the neighboring cytoplasm. The relative volumes of each type of voxel are marked proportionately to the basic unit of volume Δv, corresponding to a volume ratio among matrix, intermembrane space, and cytoplasm of 3:1:12.