
Figure 2.
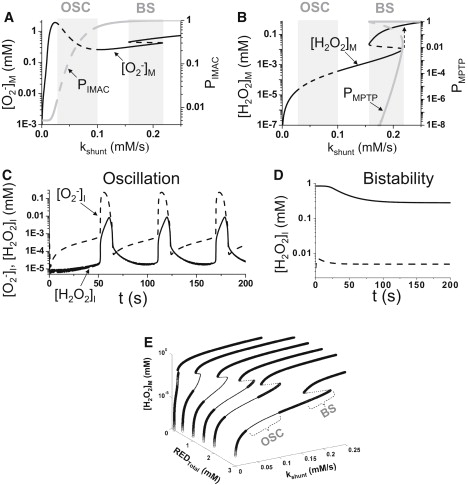
Dynamical behaviors of the single mitochondrion model. (A) Steady-state matrix superoxide concentration ([O−2]M, black line) and IMAC open probability (PIMAC, gray line) versus kshunt. Dashed segments are unstable steady states. (B) Steady-state matrix H2O2 concentration ([H2O2]M, gray line) and MPTP open probability (PMPTP, gray line) versus kshunt. Dashed segments are unstable steady states. Loss of stability of the steady state leads to oscillations (OSC zones in A and B) and bistability (BS zones in A and B). Dashed arrow indicates that as kshunt increases continuously, a sudden jump occurs in H2O2 concentration. (C) The intermembrane superoxide concentration ([O−2]I, dashed line) and intermembrane H2O2 concentration ([H2O2]I, solid line) versus time for kshunt = 0.08 mM/s, which is in the oscillatory regime. (D) The intermembrane H2O2 concentration in the bistable regime showing two stable steady states (solid and dashed lines) resulted from two initial conditions at kshunt = 0.2 mM/s. (E) Steady-state matrix H2O2 concentration ([H2O2]M) versus kshunt and REDTotal. The thick segments are the stable steady states. The thin segments are unstable steady states. “OSC” and “BS” mark the oscillatory and bistable regions, respectively.