
Figure 3.
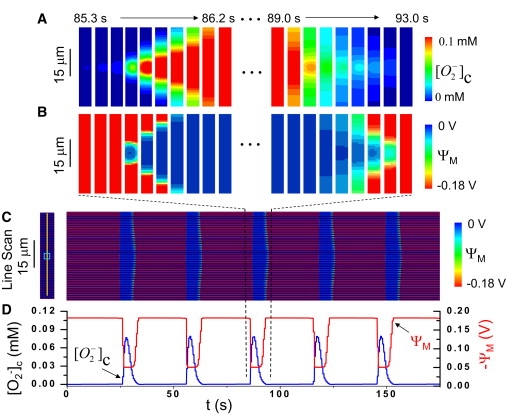
Cellwide ΨM oscillations due to fast waves of IMAC-mediated RIRR. (A–C) Periodic cellwide ΨM oscillations over a long timescale are shown in the line scan in panel C, with the scanned line and laser stimulated area as marked in the left panel. For one of these cellwide oscillations (between the dashed lines), panels A and B show snapshots of cytoplasmic O−2 and ΨM at uniform time intervals corresponding to the start (left panels) and end (right panels) of the oscillation. The mitochondrial depolarization starts from the laser stimulated area (cyan box in the left panel in C) and propagates to both ends of the whole cell. (D) The average ΨM and O−2 of the network versus time. In this simulation, kshunt was set to be 0.2 mM/s in the mitochondria in the center region (cyan box in the left panel in C) and 0.05 mM/s elsewhere.