
Figure 5.
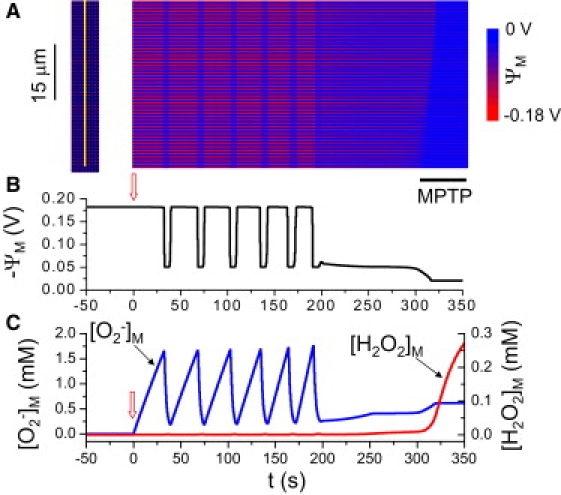
IMAC-mediated ΨM oscillations triggering an MPTP-mediated final depolarization wave. (A) Space-time plot of ΨM recorded along the yellow line indicated at the left. O−2 production rate increased progressively over time, most rapidly in the lower four rows of mitochondria (where kshunt = 0.35[0.3 + 0.7 min (1,e0.02t/150)]), and more slowly elsewhere (kshunt = 0.2[0.3 + 0.7 min (1,e0.02t/150)]). (B) Average ΨM versus time. (C) Mitochondrial O−2 (blue) and H2O2 (red) concentrations versus time. kshunt was initially zero and started to increase at the upward arrows. Black bar below the snapshot indicates the final MPTP-mediated slow wave.