
Figure 2.
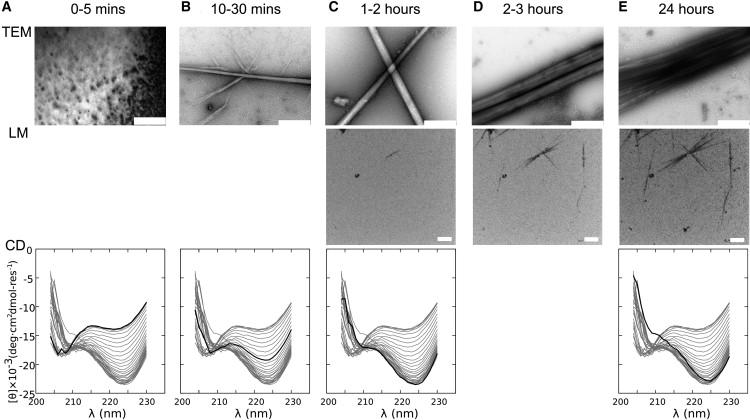
Overview of the SAF folding and assembly probed by TEM, LM, and CD spectroscopy. (A) t = 0–5 min; no change in the CD spectrum, and no fibers by TEM or LM (0% material in fibers). (B) t = 10–30 min; the CD spectra begin to change, and small fibers become visible by TEM but not LM (5–50% material in fibers). (C) t = 1–2 h; the CD spectra continue to change, TEM shows an increase in number and thickness of the fibers, and fibrous material begins to appear by fluorescence microscopy (55–65% material in fibers). (D) t = 2–3 h; fibers are unchanged by TEM (which is insensitive to fiber length), but the LM reports elongation (65–70% material in fibers). (E) t = 24 h; the CD spectrum reaches equilibrium, the TEM shows mature striated fibers, and growth is complete in the LM (70% material in fibers). Scale bar: 500 nm for TEM and 10 μm for LM; heavy lines indicate the CD spectrum for the corresponding time point. The percentages of material in fibers given in brackets were estimated as follows: the final figure of 70% came from estimates of material that remained soluble 1), after matured fibers were pelleted by AUC, and 2), the remaining NMR signal after completion of fibrillogenesis (see the Supporting Material for details regarding both of these experiments). All other figures came from the percentage completion of fibrillogenesis from the time-resolved CD data. The kinetic CD experiments were repeated three times and provided similar qualitative results, indicating a batch-to-batch variation in rates and lag times of ∼10–15%. The LM and TEM experiments were repeated multiple times (more than six) and gave qualitatively similar results.