
Figure 2.
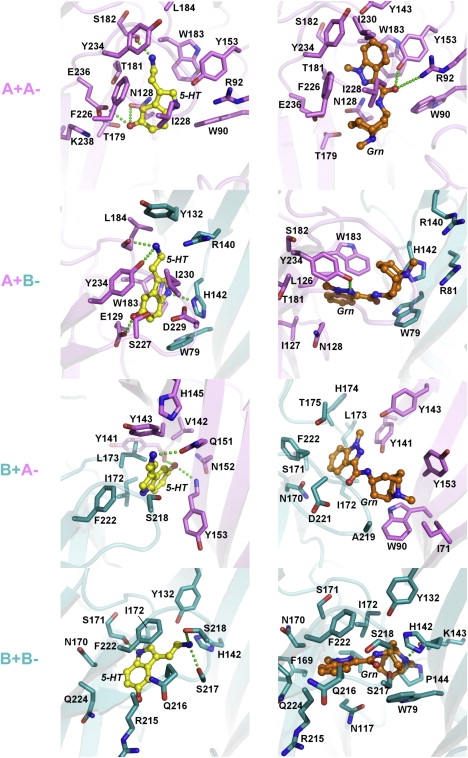
Docking of 5-HT (yellow, left panels) and granisetron (Grn, orange, right panels) into homomeric 5-HT3A (14,19) and heteromeric 5-HT3AB receptor homology models. The 5-HT3A subunit is shown in violet, and the 5-HT3B subunit is shown in teal. Residues within 4 Å of docked ligand are rendered in stick representation, color-coded according to the corresponding subunits, and numbered according to Fig. 1B. The + and − signs denote the principal and complementary face of the binding site, respectively. Proposed hydrogen bonds are shown as green dotted lines. The orientation of the docking models is the same as in Fig. 1A.