
Figure 2.
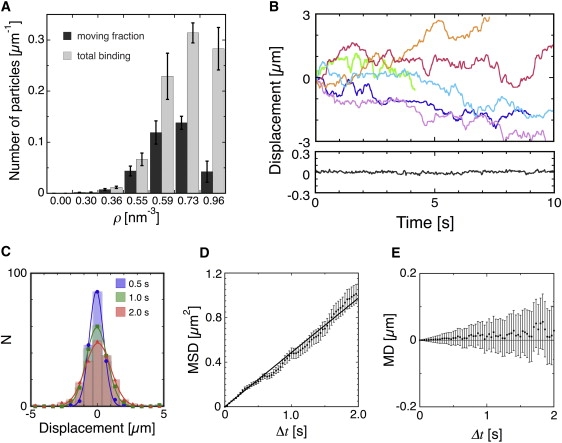
Interaction of the charged nanoparticles with the MTs. (A) Binding of charged nanoparticles to the MTs examined by DFM. The total number of particles on the MTs (shaded) and the number of moving particles (solid) per unit length of the MTs are plotted as a function of the amine densities of the particles. One minute after the particle suspension was introduced into the flow cell, 9–18 fields were scanned within 5 min and their images were recorded for later analysis. For each MT, the numbers of moving (SD ≥ 30 nm) and stationary (SD < 30 nm) particles during a single 10-s observation period were counted. The numbers of moving/stationary particles on MT lengths of 300–800 μm were summed, normalized for the particle concentration used in each experiment (Table S1) and divided by the MT lengths, which gave the number of bound/moving particles per unit length of MT. (B) Examples of the back-and-forth movements of the charged particles along the MTs. Each trace shows the track of an individual nanoparticle with amine density of 0.59 nm−3. The upper and lower panels show the motions parallel and perpendicular to the long axes of the MT, respectively. In the upper panel, displacement in the plus direction corresponds to motion toward the MT-plus end. (C) Distributions of the particle displacements in 0.5-, 1.0-, and 2.0-s intervals. (D) MSD and (E) mean displacement of the particles plotted against time. The error bars represent mean ± SE.