
Figure 3.
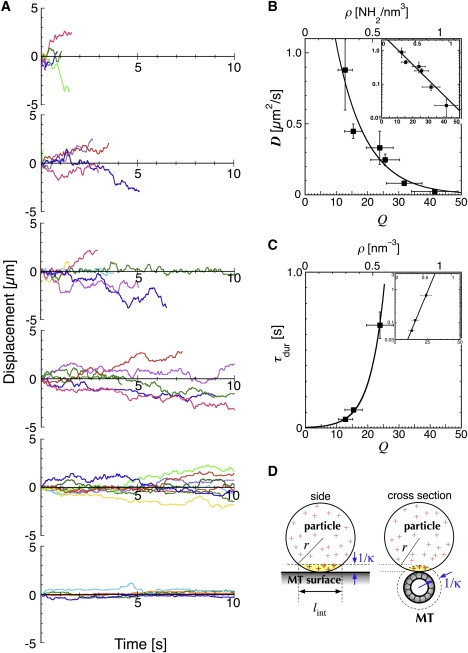
Analysis of one-dimensional Brownian motion. (A) Typical traces for the displacements of particles with amine densities of (from the top downwards) 0.30, 0.36, 0.55, 0.59, 0.73, and 0.96 nm−3. (B) Diffusion constant of the particle, D, plotted against ρ or Q. D is the average of more than five independent diffusion constants, each calculated from an MSD plot for >10 particles over a total sampling time of 20 s. The error bars in the vertical and horizontal axes represent SD. The diffusion constant D appears to be an exponential function of Q, i.e., the data show good fit to the equation: where D0 = 3.0 μm2/s and ΔE1 = 0.10 kBT per charge (inset). (C) Mean duration of the interaction plotted against ρ or Q. The error bars represent standard error of fit (vertical axis) and SD (horizontal axis). The data show good fit to the equation: where τ0 = 3.6 ms and ΔE2 = 0.22 kBT per charge (inset). (D) Q was calculated based on the amine density of the particle (ρ), radius of the particle and MT, and the Debye length (κ−1 = 1.29 nm). For a particle of diameter 59 nm, Q = 43.2 × ρ, and lint = 17 nm (see Materials and Methods for details).