
Figure 6.
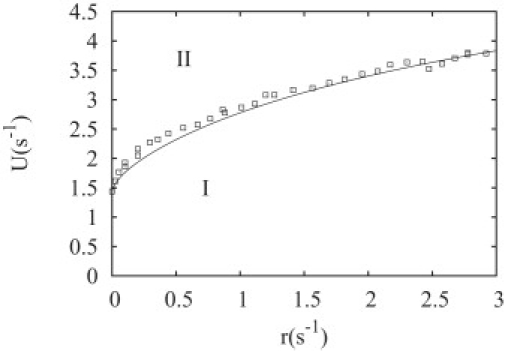
Phase diagram of the random hydrolysis in the coordinate on-rate U versus hydrolysis rate r (per site). The symbols have been obtained from Monte Carlo simulations, whereas the solid line is the mean-field theory of the Appendix. For r = 0, we recover the value of U corresponding to the critical concentration of the vectorial model.