
Figure 6.
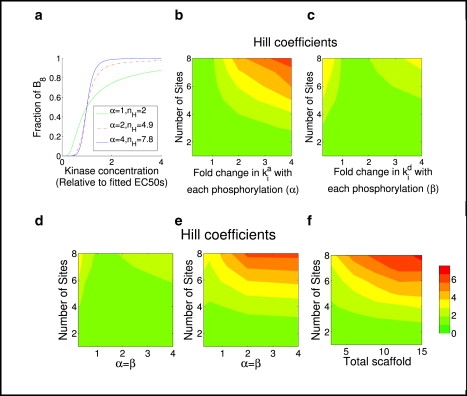
Typical cases for the scaffold protein model shown in Fig. 5. (a) Plot, assuming eight phosphosites (n = 8), showing how the fraction of free B that is fully phosphorylated varies with the concentration of kinase A. The value α is the fold-change in the scaffold binding rates (i.e., ). For each value of α, the corresponding effective Hill number nH is also shown. Each curves is normalized by setting its EC50 to 1. (b) Hill coefficients as a function of number of phosphosites and fold change of scaffold binding rates with each phosphorylation. (c) Hill coefficients as a function of number of phosphosites and fold change of scaffold dissociation rates with each phosphorylation. (d) Hill coefficients as a function of number of phosphosites and simultaneous fold change of scaffold binding and dissociate rates at each phosphorylation, with λi = = 1. (e) The same as panel c except ki/ki−1 = 2 and di/di–1 = 1/2 for all i. (f) Hill coefficients as a function of the number of phosphorylation sites and the total amount scaffold. In this case, the parameters are α = β = 4, λi = = 1, ki/ki−1 = 2, and di/di–1 = 1/2. In panels a–f, St = 15, Bt = 10, with all other parameters equal to 1 except as specified otherwise in the figure.