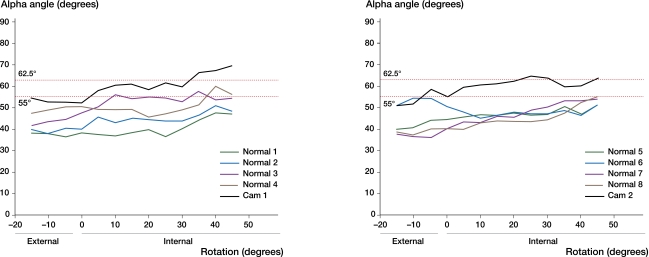
Figure 3.
Graphs showing the relationship between rotation and alpha angle in the ten cadaver femora. The data are presented in 2 graphs to facilitate visual interpretation. There are four normal femora and one pistol-grip (cam) femur in each graph. The horizontal dotted lines represent 1 and 1.96 standard deviations above the mean.

