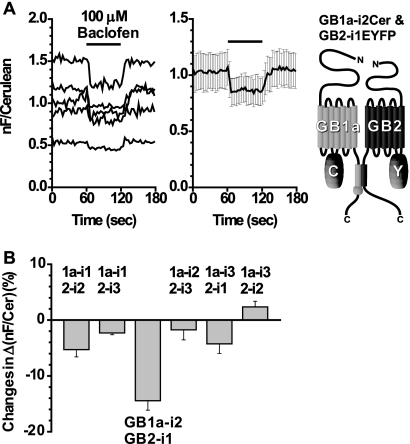
FIGURE 2.
FRET between the GB1a and GB2 intracellular loops with diagonal relationships. A, left, the GB1a-i2Cer and GB2-i1EYFP pair displayed a FRET decrease by applying baclofen. Application profile was the same as in Fig. 1. Middle, plots are means ± S.E. (n = 5). Right, schematic drawing of the GB1a-i2Cer and GB2-i1EYFP pair. B, bar graphs summarizing FRET changes in Δ(nF/Cerulean) (%) (where nF is net FRET). Among the six possible combinations, only the GB1a-i2Cer and GB2-i1EYFP pair exhibited a FRET change that was more than 10%. From left to right: GB1a-i1Cer and GB2-i2EYFP (n = 5), GB1a-i1Cer and GB2-i3EYFP (n = 5), GB1a-i2Cer and GB2-i1EYFP (n = 5), GB1a-i2Cer and GB2-i3EYFP (n = 5), GB1a-i3Cer and GB2-i1EYFP (n = 3), and GB1a-i3Cer and GB2-i2EYFP (n = 5).

