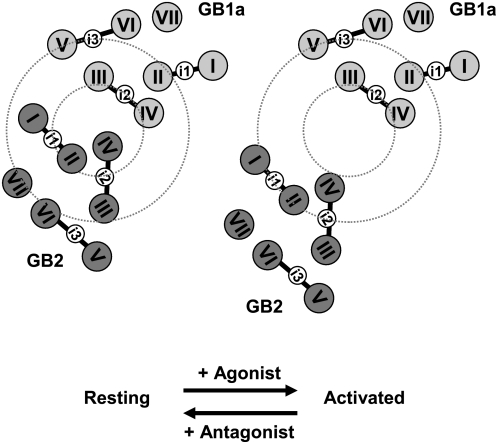
FIGURE 8.
Scheme for the agonist-induced activation of the GABABR. A scheme representing the asymmetrical rearrangement of the subunits GB1a and GB2 upon agonist-induced activation. The 7TMD configuration is based on the cytoplasmic view of the rhodopsin crystal structure. Note that the activation involves dissociation of the two subunits, but the helical configuration of each subunit is kept unchanged. A small dotted circle denotes a region where the loops involved in large FRET decreases are positioned at the resting state. A large dotted circle demarcates a region where the nonresponding loops are placed at the resting state.

